Curriculum Vitae
Education
- M.Sc. Political Science, Waseda University, 2024–2026
- Erasmus+, Sungkyunkwan University, 2021
- B.Sc. Data Science, FHSTP, 2018–2022
- Various Schools, Austria, Germany, France, 2005–2017
Professional Experience
-
Datajournalist, ThePioneer, 2022–2024
Visualizations and data research for a daily newsletter on economic and geopolitical affairs. Authored articles and performed weekly NLP analysis of news and MP traction.
-
IT Consultant, Wedobi, 2021–2022
Database management and SAP consulting for a startup.
-
Research Assistant, ExploreAI, 2019–2021
Literature reviews for AI applications in the Austrian Military.
Skills
- Data Analysis (Python, R)
- Web Development (HTML, CSS, JavaScript)
- Database Management (SQL)
- Data Visualization (Tableau, Matplotlib, Gephi, D3)
- Academic Writing
- Statistical Modeling
Languages
- German (Native)
- English (Fluent)
- French (B2)
- Japanese (N4)
Working Papers
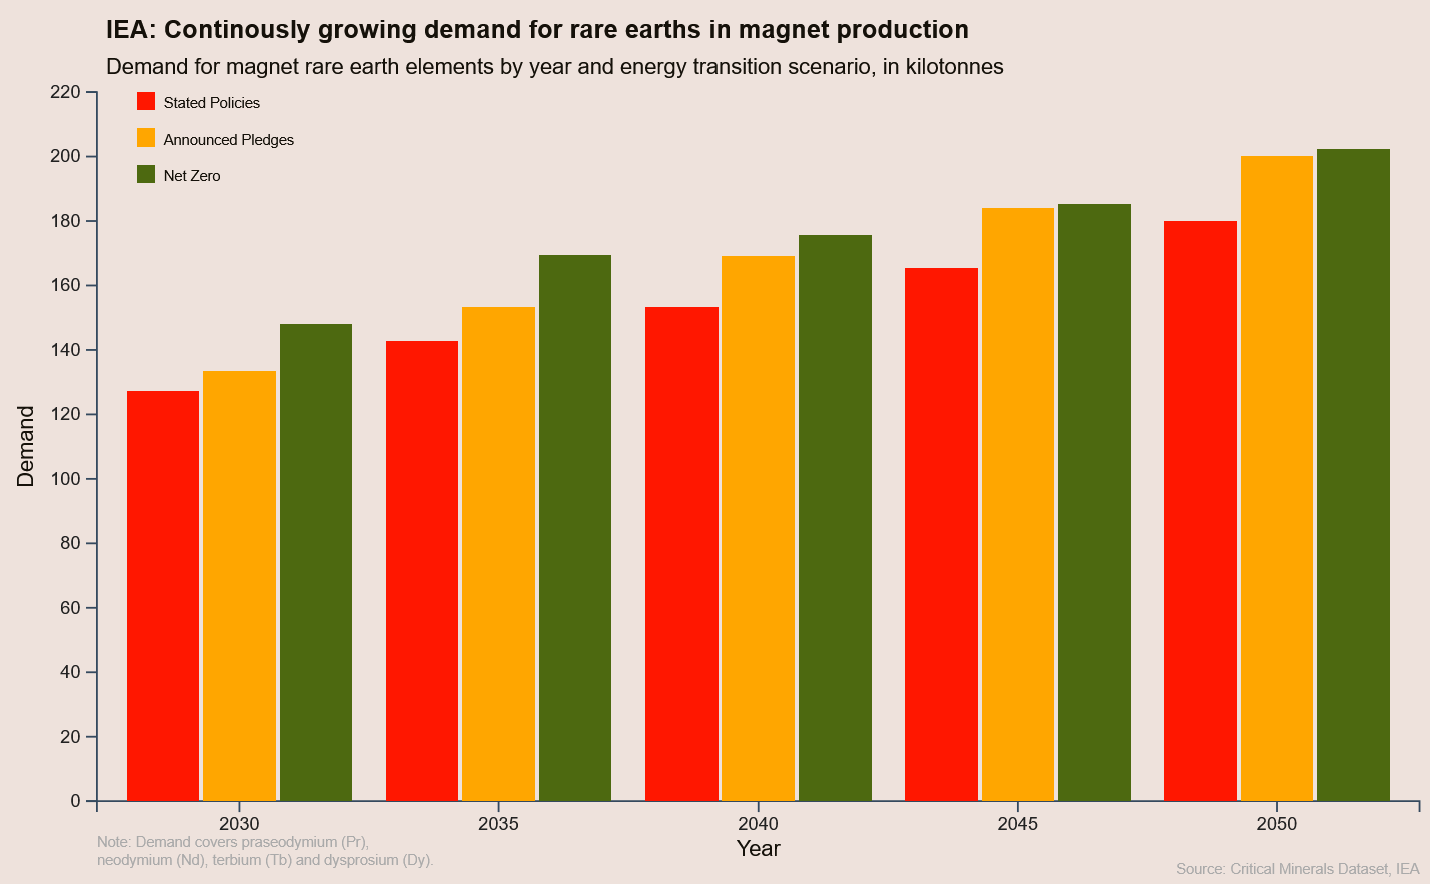
Through which industrial policies did China enable its dominance in the global rare earth industry?
Analysis of CCP industrial policies enabling China’s dominance in rare earths. Focus on upstream extraction, midstream processing, and downstream application.
Read Paper
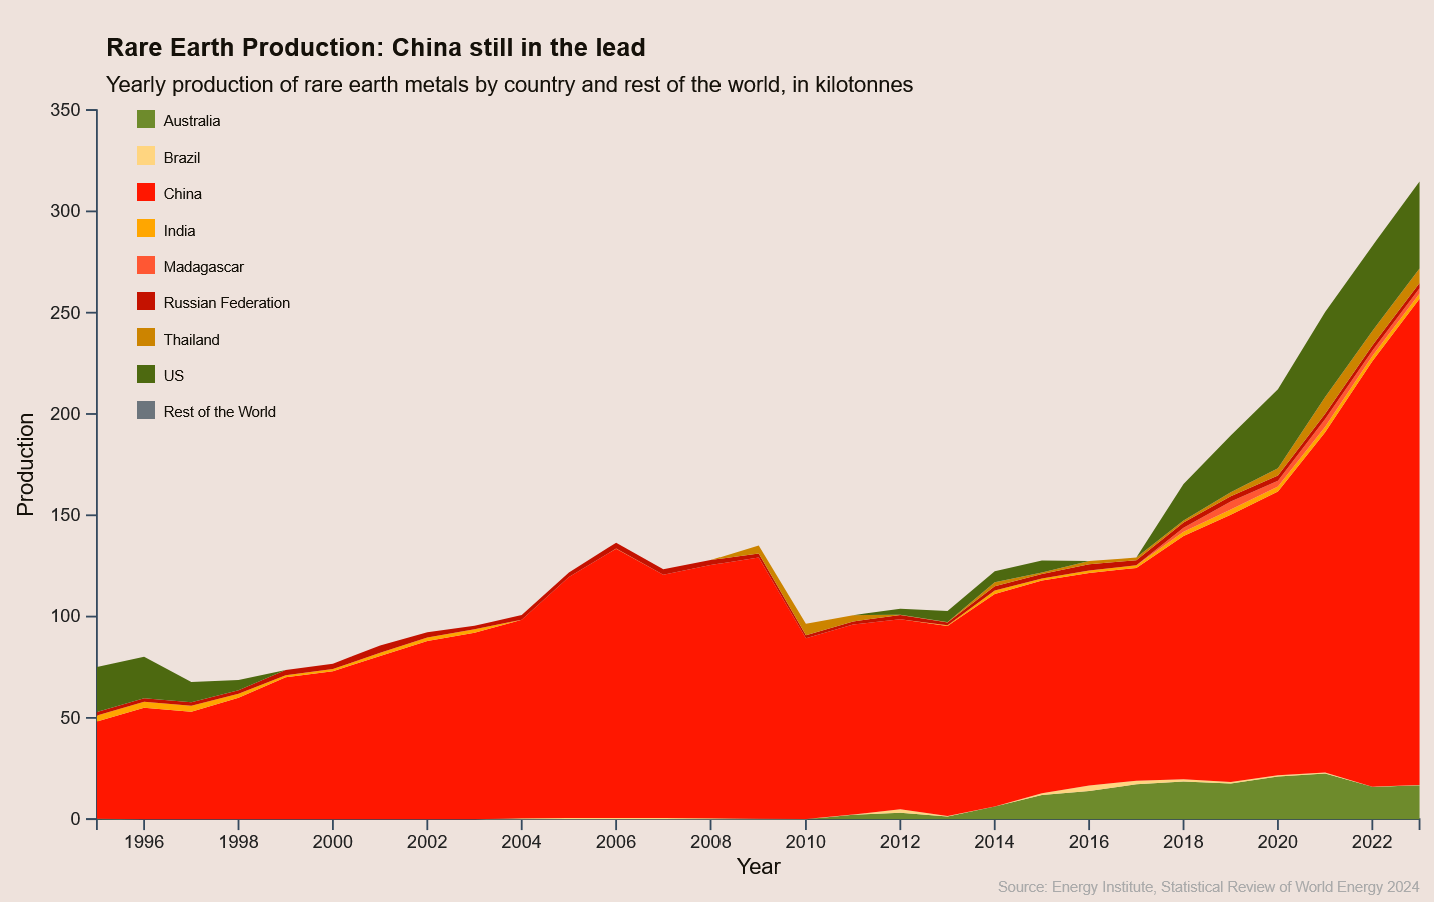
China dominates the Rare Earth Industry. How do we measure it?
This methodology paper examines China's dominance in the rare earth industry by modeling global trade as a complex network. By taking advantage of the known fact that China dominates the market, I am looking at different indices to measure this dominance.
Read Paper
Rare Earth Mining Industry in China and its Environmental Impact
Using geospatial data on RE mines and processing facilities, this paper employs an Ordinary Least Squares OLS regression model to test the relationship between a reservoir's proximity to these sites and its water's electrical conductivity.
Read Paper
Visualizations
A selection of visualizations I have created for various projects, including data journalism and academic research. The main focus is kept on the visualization dealing with the Rar Click below to see all visualizations.
See all visualizations
Network Construction
How is are the trade networks for my research constructed? This section explains the methodology and mathematical background. This includes data sources, cleaning, and the actual network construction process. In the future there will also be interactive examples of the networks constructed using D3.js, but at the moment the networks are still static images. If you are interested in the actual networks, please check out the working papers section above or my GitHub.
Read full explanation